The auction, written down.
Everything we’ve worked out about reading the market, the theory, the structure, the craft, set down in order. No signals, no secret sauce, a couple of bad jokes left in. Start at the top, or raid what you need.
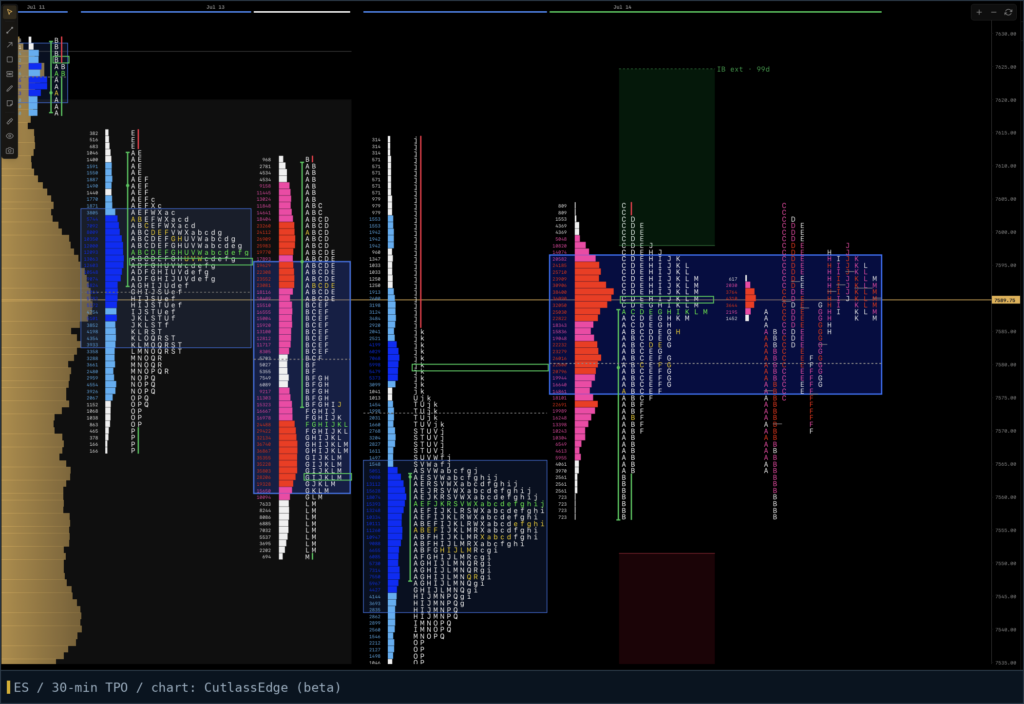
What is market profile? A trader’s guide
Market profile turns price and time into a picture of the auction. What the TPO chart is, what actually matters, and what it can’t do.
Your first week
Read the pillar, then follow the line. Five notes and you can read a session.
- 01How to read a TPO chart, letter by letterThe mechanics: how the letters build a day.9 min
- 02Value area explained: VAH, VAL, and the 80% ruleWhere the day did its business, and the levels that matter.6 min
- 03Initial balance: the first hour’s mapWhat the first hour tells you about the day ahead.7 min
- 04Market profile day types: a session’s six personalitiesRecognizing what kind of day you’re in.6 min
- 05Balance rules: the five ways a market leaves a rangeThe framework for trading the exit, no predicting.9 min
The Profile
The chart and its structure: TPO, value, POC, tails and single prints, and how to read the shapes a day leaves behind.
What is market profile? A trader’s guide
Market profile turns price and time into a picture of the auction. What the TPO chart is, what actually matters, and what it can’t do.
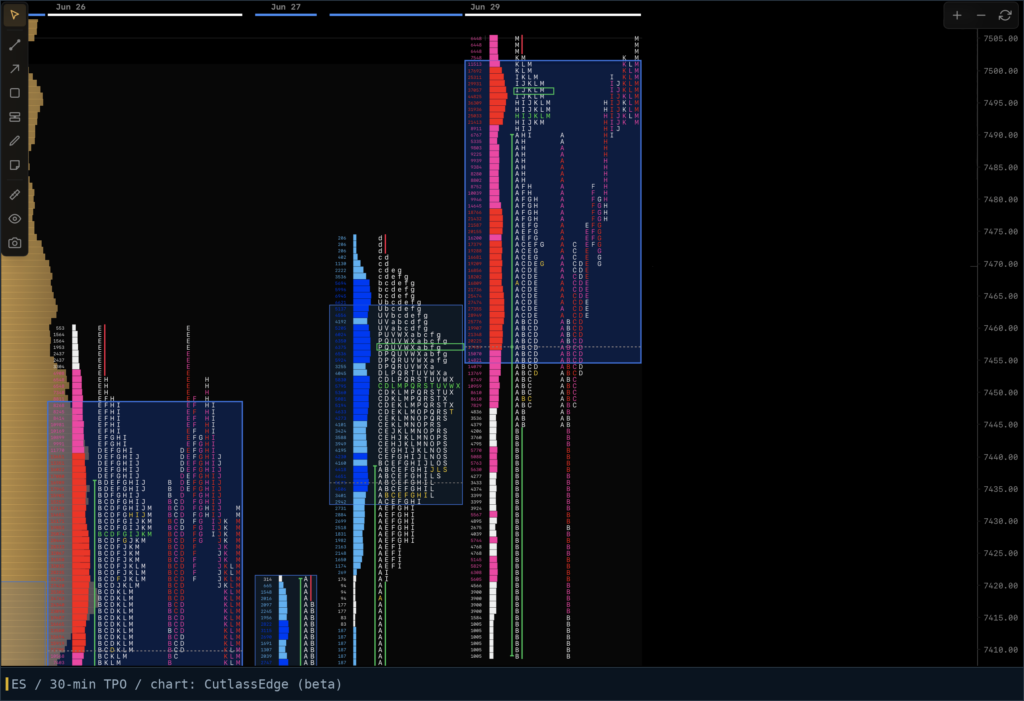
How to read a TPO chart, letter by letter
How the letters build, what the shapes mean, and the checklist Charles runs every session.
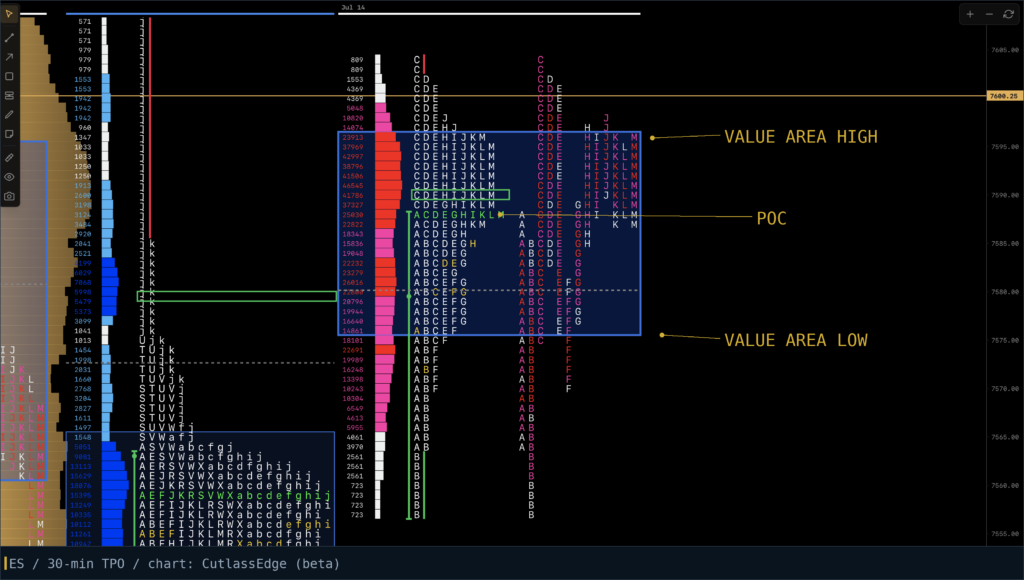
Value area explained: VAH, VAL, and the 80% rule
How VAH and VAL are set, the five value relationships, and the 80% rule.
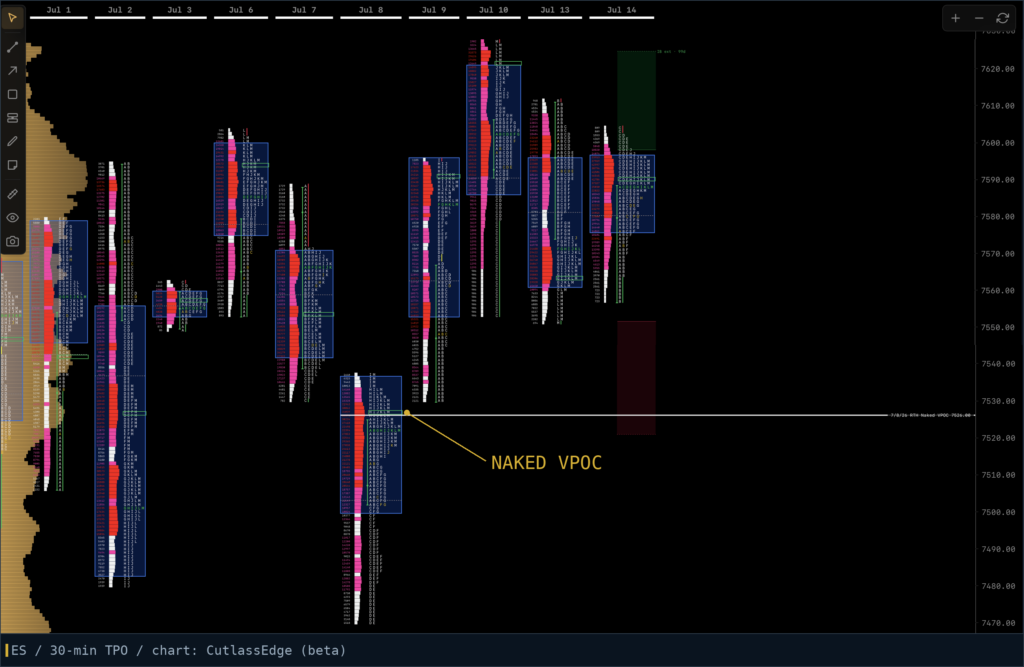
Naked POC: why price remembers
Why old points of control keep pulling price back, and how to keep them on your chart.
Auction Theory
Why the market moves the way it does: balance, imbalance, and the logic underneath the chart.
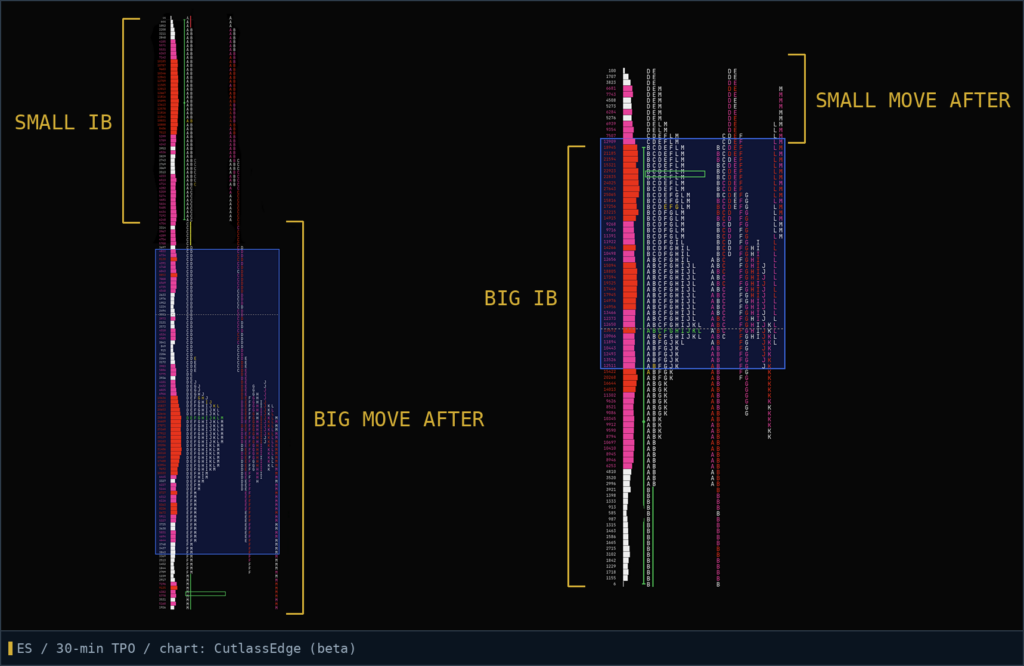
Initial balance: the first hour’s map
What the initial balance is, and what its width tells you about the day ahead.
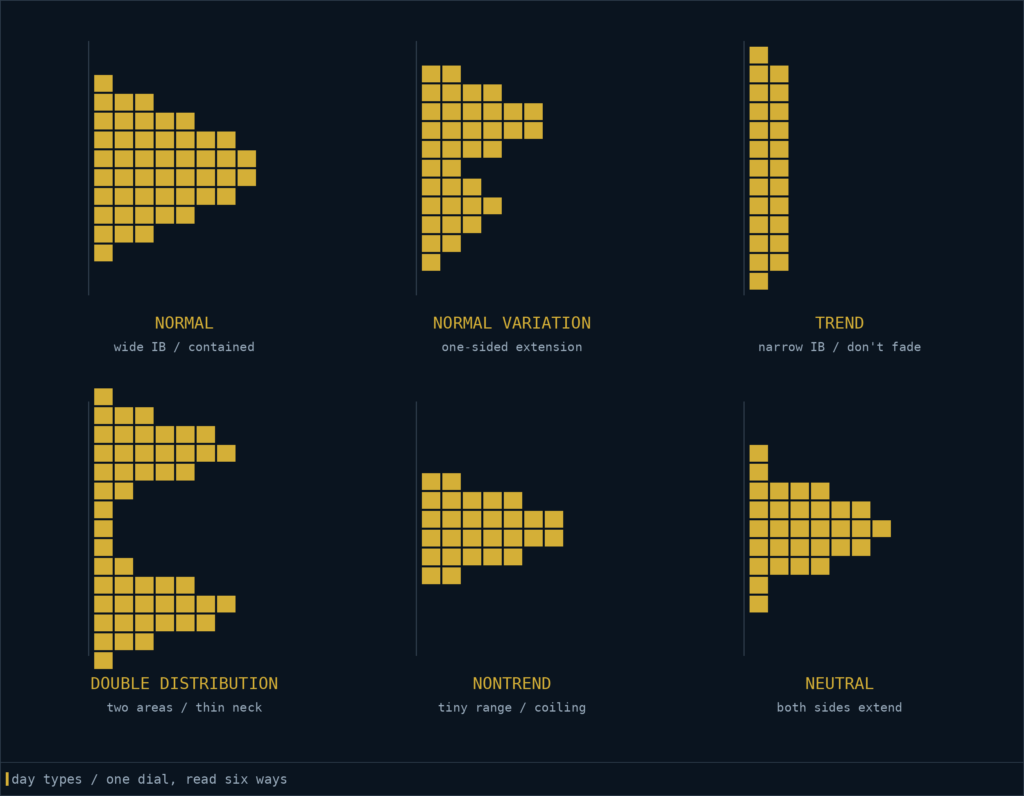
Market profile day types: a session’s six personalities
Trend days, normal days, neutral days, and how to recognize each as it develops.
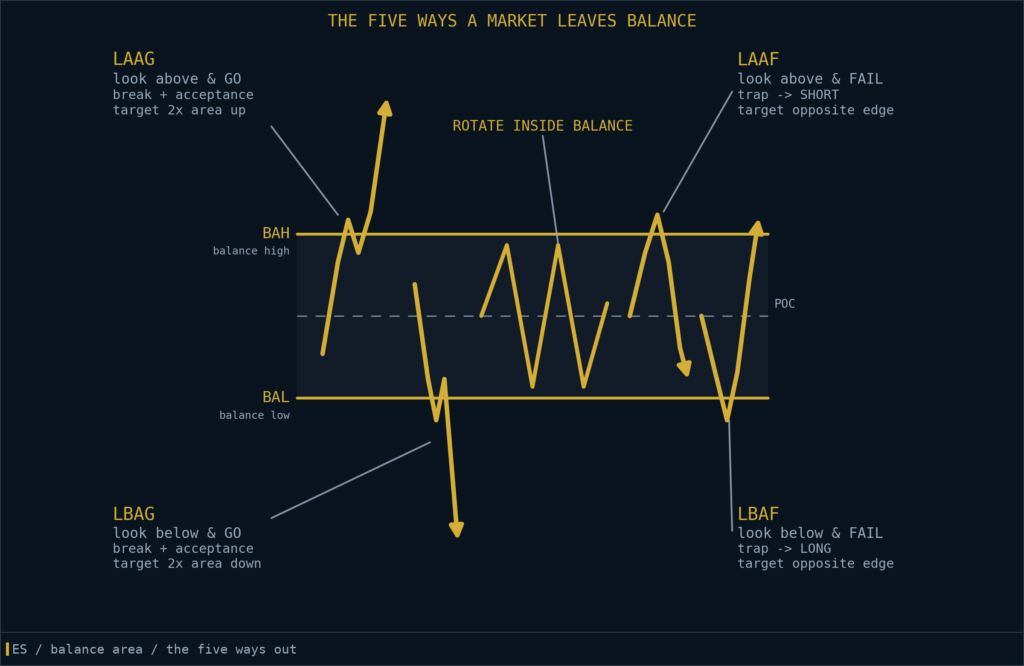
Balance rules: the five ways a market leaves a range
When a market coils into balance there are only five ways out. The complete framework.
Trader’s Notebook
Everything else a trader runs into: routines, prep, market internals, and whatever comes up between sessions.

Pre-Market Checklist
A top-down morning routine: monthly, weekly and daily trend, the key references, then yesterday’s profile.
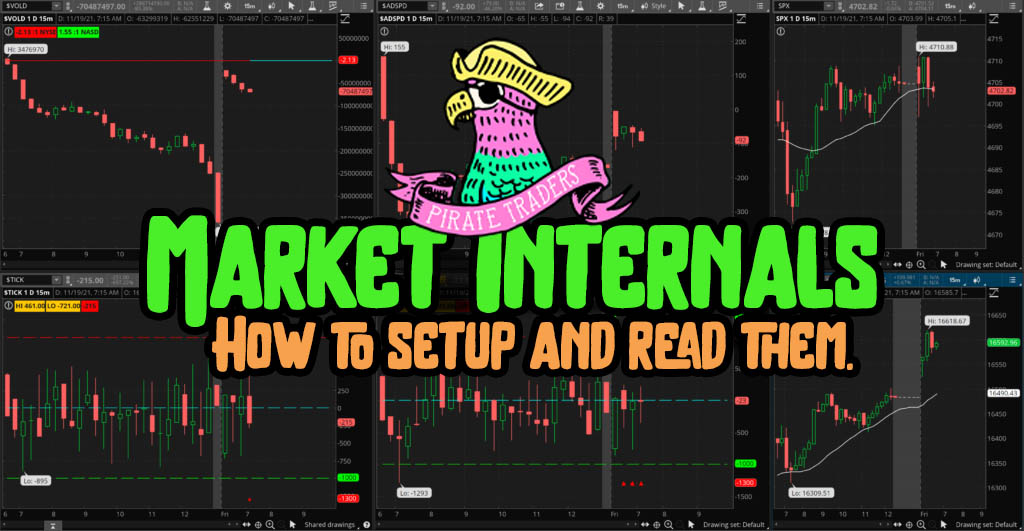
Market Internals – How to setup and read them.
How Charles sets up his market internals, starting with VOLD and ADSPD, and what he reads in each.
Market Profile is a registered trademark of CME Group. It’s used here descriptively, to discuss the methodology.