What is market profile? A trader’s guide
Most charts answer one question: where has price been. Market profile answers a more useful one: where did the market actually do business, and where did it get rejected.
That distinction sounds small. It is not. A candlestick chart shows you a fight’s final score. The profile shows you the fight: where both sides spent their time, where one side ran out of interest, and which prices the market considered fair versus which ones it slapped away in minutes.
Market profile is not an indicator. There’s nothing to optimize, no settings to tweak until the backtest looks pretty. It is a different way of organizing the same price and time data you already have, built to show the structure of the auction. Once you can read that structure, a plain chart starts feeling like watching a game with the sound off.
I used to jump from thing to thing searching for the “answer”. Regular candlesticks, Heikin-Ashi candlesticks, RSI, MACD, Bollinger Bands, VWAP and standard deviations, Ichimoku Cloud, on and on the search went, “which of these will make me profitable?” Then Jim Dalton taught me something that changed my trajectory forever as a trader. The tools are simply a way to understand the auction process, it’s the auction that drives the moves, it’s the auction that I must master. The best tool for understanding the auction (price, time, and volume) is the market profile.
Where market profile came from
Market profile was developed in the 1980s by J. Peter Steidlmayer, a trader at the Chicago Board of Trade, working with the exchange itself. The pit traders could feel the auction happening around them: who was aggressive, where the market went quiet, when a price stopped attracting business. Off-floor traders got none of that. The profile was built to put that information on paper.
The core idea underneath it is auction market theory. Markets exist to facilitate trade. Price moves to advertise for business, time regulates how much business gets done at each price, and volume tells you whether the advertising worked. Every session is a two-way auction, and the profile is the auction’s receipt.
The pits are gone. The auction is not. Algorithms did not repeal the reason markets move; they just changed who is doing the bidding. That is why a charting method from the 1980s still describes what ES does at 9:31 this morning.
How a TPO chart builds, letter by letter
TPO stands for Time Price Opportunity. On a TPO chart, the trading session is cut into 30-minute periods, and each period gets a letter. The first half hour is A, the second is B, and so on through the day.
Every price the market touches during a period gets that period’s letter printed next to it, once. Touch 6870 during the A period, an A prints at 6870. Come back to 6870 in the D period, a D prints beside it.
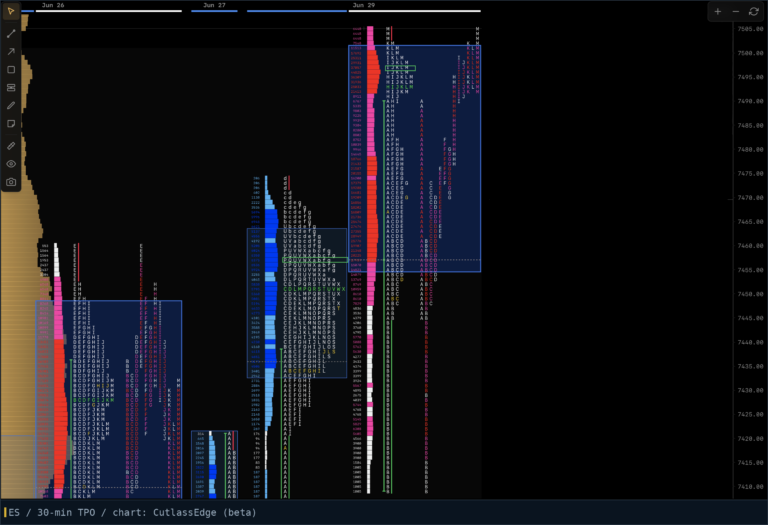
Stack the letters up and the day builds a shape. Prices the market kept coming back to grow wide with letters. Prices the market rejected stay thin, sometimes a single lonely letter. On a normal day the shape looks something like a bell curve turned sideways: fat in the middle where business got done, thin at the edges where one side gave up.
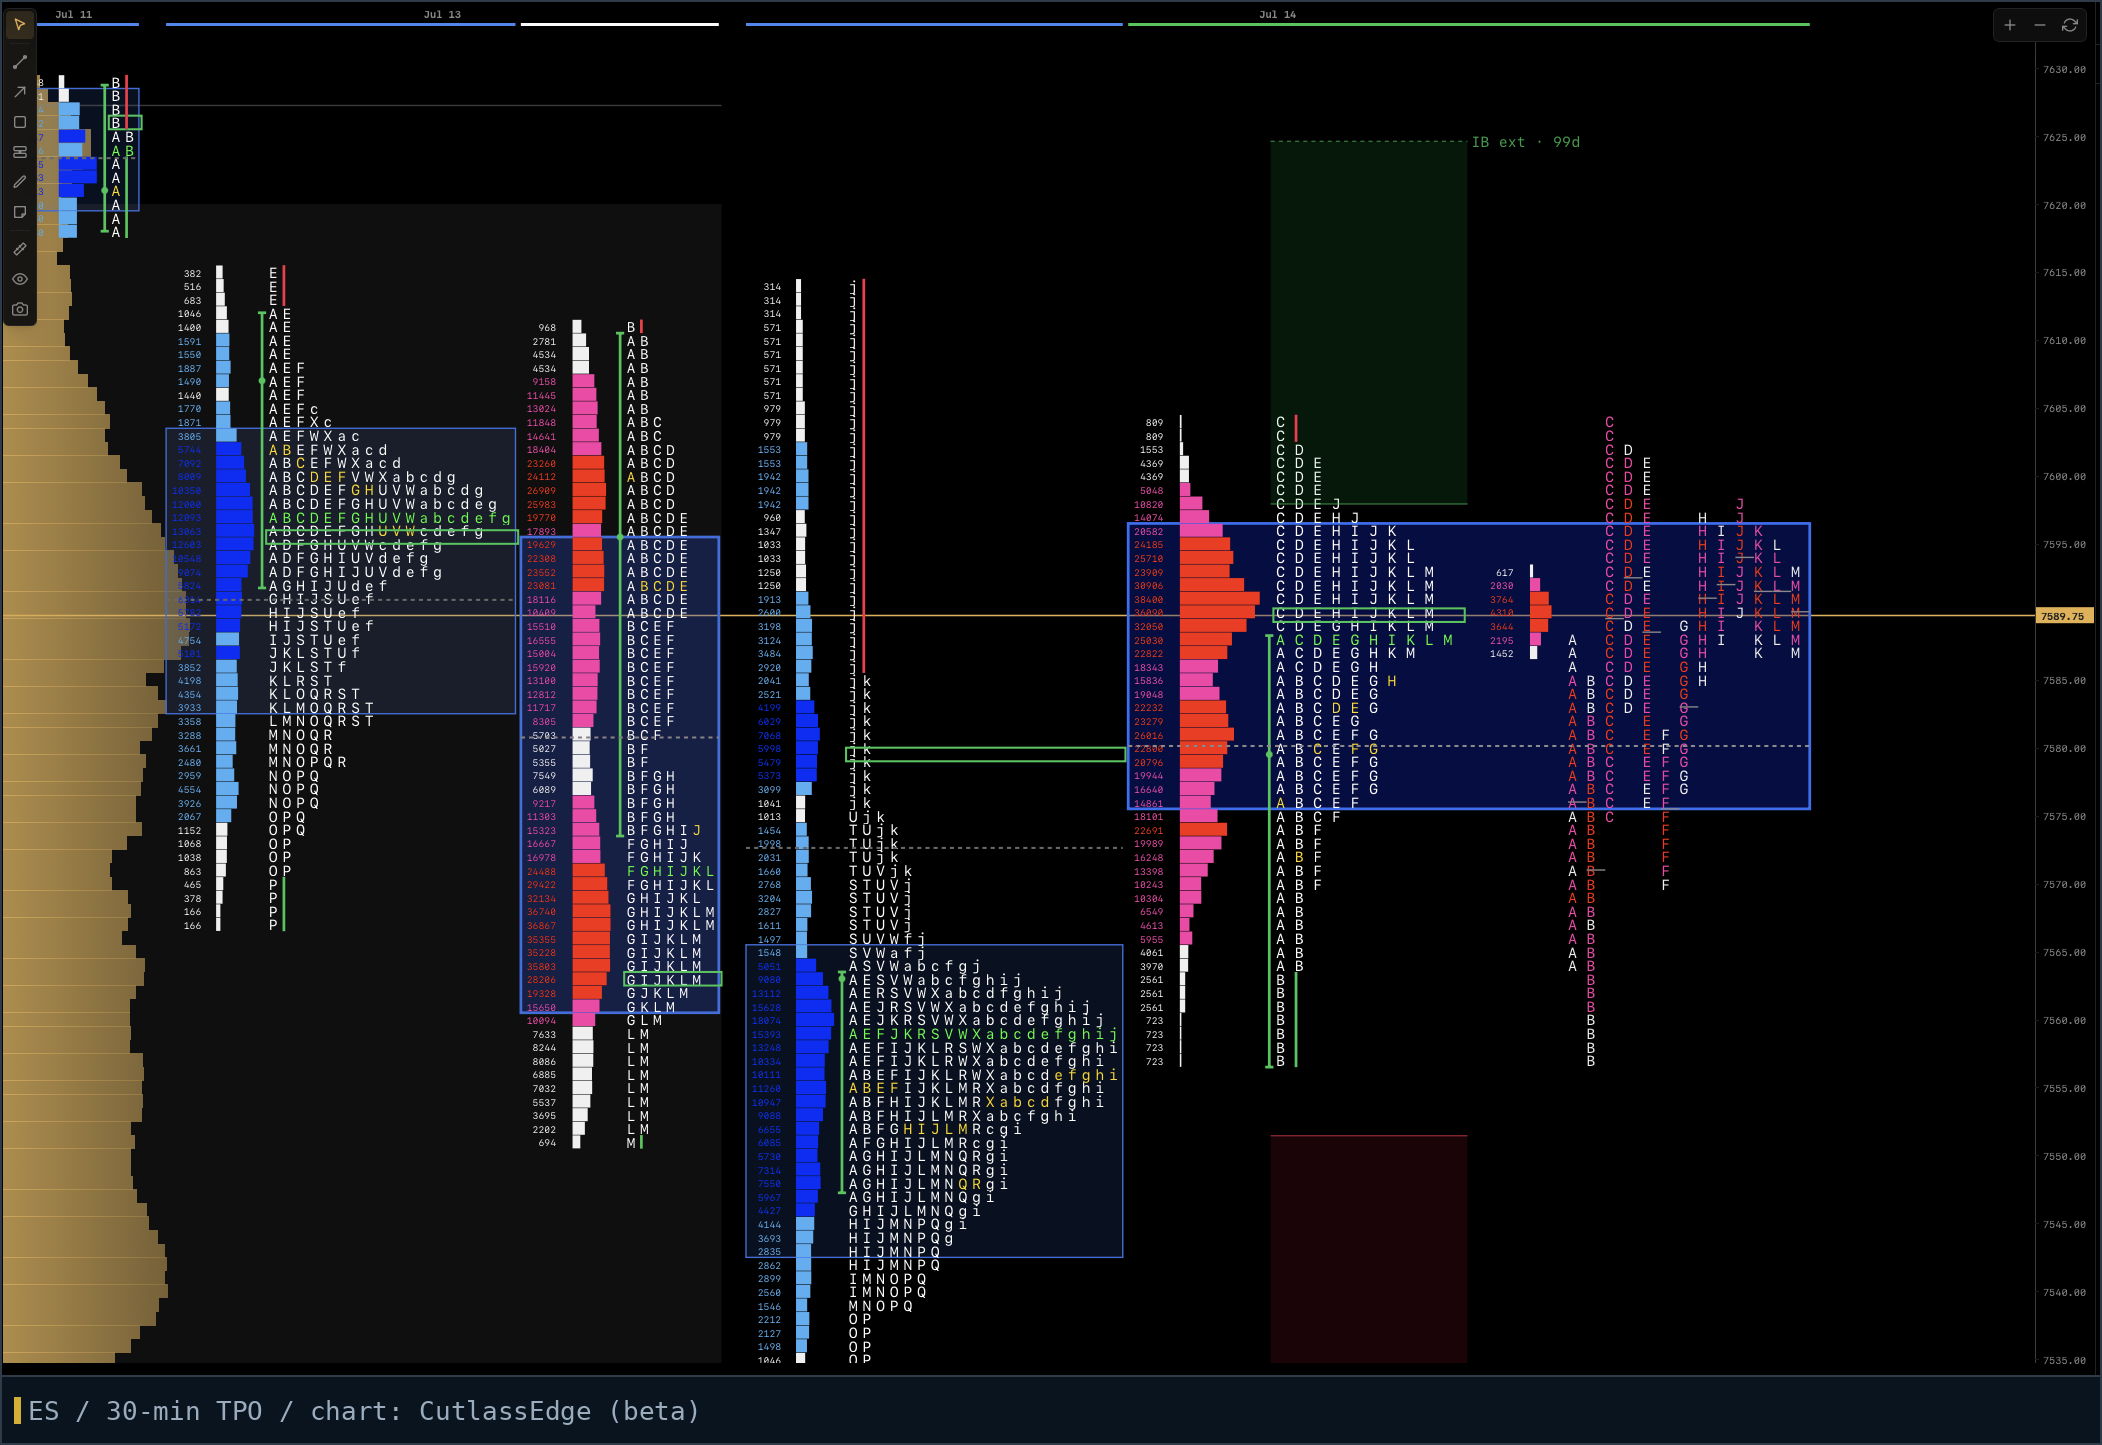
That shape is the whole trick. Wide means acceptance. Thin means rejection. Everything else in market profile is a more precise way of talking about wide and thin.
The structures that matter
You can trade the profile for years and use maybe six concepts daily. These are the ones that earn their place on the chart. Each one links to a deeper guide or a glossary entry.
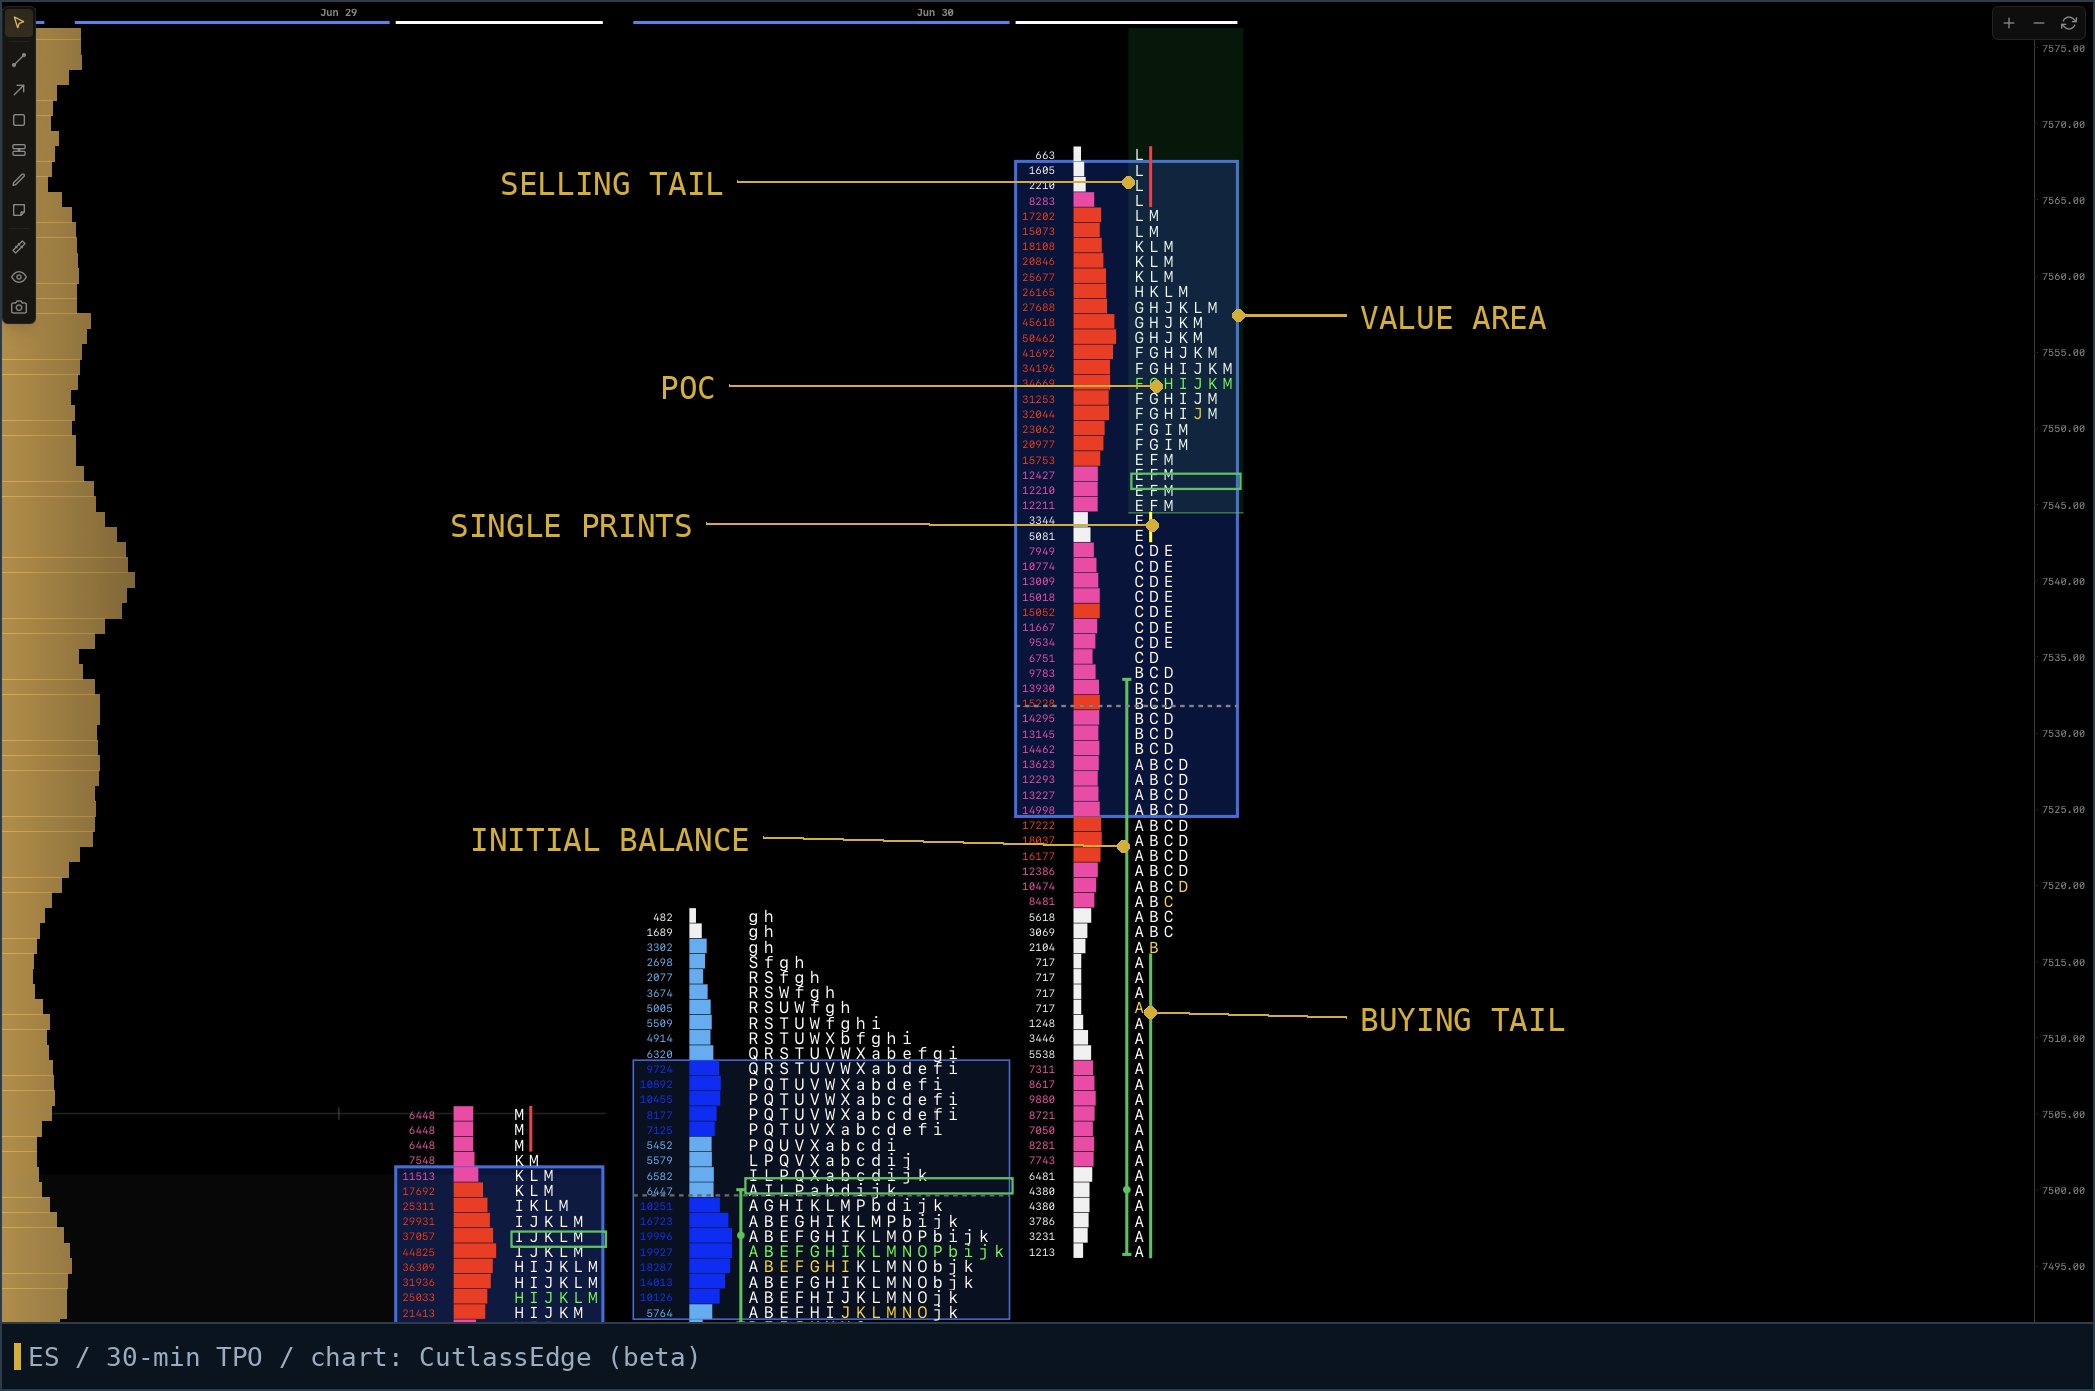
Point of Control (POC)
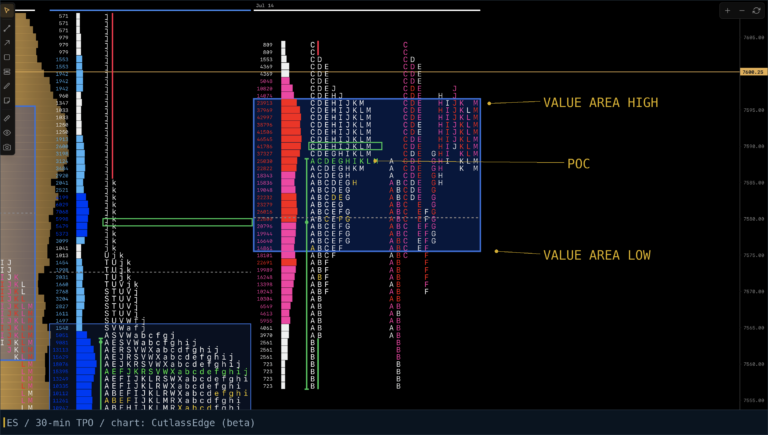
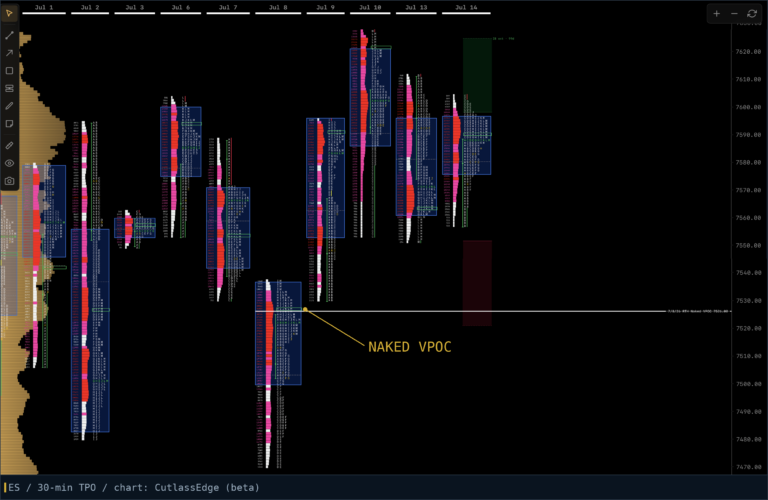
The POC is the price with the most TPOs in the session, closest to the center of the range. I call it the fairest price to do business: the level where buyers and sellers agreed the longest. Intraday, the time-based POC tends to act like a magnet during rotational trade. There’s also a volume POC (the price where the most volume traded), which matters on later days: if price re-enters an old range, the old VPOC is a natural target. More on that in Naked POC: why price remembers.
Value area
The value area is where roughly the middle 68 to 70 percent of the session’s business happened, one standard deviation around the POC. Above value, buyers are paying up. Below value, sellers are hitting out. And each morning, the relationship between today’s developing value and yesterday’s completed value (higher, lower, overlapping, inside) is one of the fastest context reads available. Full guide: Value area explained.
Excess and tails
When price probes an extreme and gets rejected fast, it leaves a tail: a thin stretch of single letters at the high or low. Tails are the auction saying “wrong price, no thanks.” On ES I want to see at least two letters of excess to call an extreme finished. A high without excess is a poor high, unfinished business the market often comes back to repair. That idea alone will change how you look at highs and lows: Poor highs, weak highs, and single prints.
Single prints
Levels inside the range with only one TPO. The market moved through them so fast that no business got done, usually on emotion or a news pop. They tend to get revisited, and the base of the singles often acts as support or resistance on the way back.
Initial balance
The range of the first hour, 9:30 to 10:30 ET. It is the opening bracket the rest of the day either respects or breaks. A narrow initial balance is kindling for a big directional day. A wide one often contains the whole session. Guide: Initial balance: the first hour’s map.
What the profile is actually for
Context. That’s the honest answer, and it is worth more than it sounds.
At any moment the profile is answering a short list of questions. Is the market in balance (building value, rotating) or out of balance (trending, seeking new business)? Is the move being accepted (time and volume following price) or rejected (price snapping back)? Where is the unfinished business above and below?
From those answers you build scenarios, not predictions. When a market has been balancing for days, there are only a handful of probable ways it resolves, and you can have a plan for each before the open. That framework is its own post: Balance rules: the five scenarios. Same for the recurring shapes days take: Market profile day types.
None of this tells you what will happen. It tells you what is happening, which is the thing most traders skip on the way to guessing.
What market profile will not do for you
This part usually gets left out of articles like this, because the person writing wants to sell you a course with a secret in it.
The profile will not give you signals. There is no letter combination that means buy. It will not make a bad trader profitable, and it will not remove losing trades from your future. I read the profile every morning and I still take losing trades every week. The profile’s job is to make sure those losses come from variance, not from fighting the market’s context.
It is also not magic that algorithms killed or magic that algorithms can’t touch. It is neither. It is a lens. The auction it describes is still how any liquid two-sided market allocates prices, which is why the lens still works, and a lens is only as good as the eyes behind it.
The profile doesn’t always bring wins. Sometimes I miss out on trades when the market is trending higher all day because I see it left a poor high behind and I know it needs to come back and repair it. Sometimes I go short at a high because I’m watching the tempo slow and volume get thin, and I think the move up is over, only to have my face ripped off by another wave of FOMO buying and short covering. What the profile provides me is an edge: an ability to know when and how I should take trades, not whether they will work. If I combine my edge with discipline in execution and follow my risk management rules, I am profitable at the end of the week, regardless of how often I am right.
How to start reading the profile tomorrow morning
You need three things, in this order.
Understanding first. The foundational books are Jim Dalton’s Mind Over Markets and Markets in Profile. Start with Mind Over Markets. Read it slower than you want to.
Then data and something to draw the chart. TPO charting needs intraday data for your market and software that can build profiles. Options range from add-ons in mainstream platforms to dedicated tools that cost more per month than most traders’ first profitable week. I’m building my own answer to that problem, CutlassEdge, which is in development now (that link is ours, so treat the opinion accordingly).
Then screen time, structured. A routine that works: after each close, mark the session’s POC, value area, and any poor highs or lows and leftover singles. Before each open, note where the overnight sits relative to yesterday’s value. Do that for a month and the profile stops being letters and starts being a story.
FAQ
Is market profile still relevant in modern, algo-driven markets?
Yes, with a caveat. The profile describes the auction process, and the auction process is still how prices get made, whoever is doing the bidding. What changes over time is the tempo and the players, not the logic. The caveat: relevance is not edge. The profile organizes the market; your edge still has to come from what you do with it.
What’s the difference between market profile and volume profile?
Market profile organizes the session by time at price (TPOs). Volume profile organizes it by volume at price. They usually agree, and the disagreements are informative. Most profile traders, me included, use both. Full comparison: Volume profile vs market profile.
Do I need expensive software?
You need software that draws TPO charts properly, and the dedicated tools have historically been expensive. That gap is a real problem for newer profile traders, and closing it is exactly why CutlassEdge exists. Disclosure: it’s our product.
What markets does it work on?
Anything liquid with a genuine two-sided auction. It grew up in futures, and index futures like ES and NQ remain the best-documented home for it. Thin markets produce thin, unreliable profiles.
Is market profile good for beginners?
The concepts are learnable by anyone willing to put in screen time, and starting with auction logic beats starting with indicator soup. But it is a framework for understanding markets, not a shortcut past learning to trade. There is no shortcut past learning to trade.
Charles Gough is a full-time ES futures trader and the founder of Pirate Traders. He has traded the auction every morning since 2020, and has the painful losses to prove he’s telling the truth about variance.
Disclosure: CutlassEdge is built by Pirate Traders. Every chart in this post was produced in its development build. No other tool mentioned here pays us anything.
Market Profile is a registered trademark of CME Group. It’s used here descriptively, to discuss the methodology.