Value area explained: VAH, VAL, and the 80% rule
Every session, the market runs an argument about what something is worth. The value area is where the argument mostly settled.
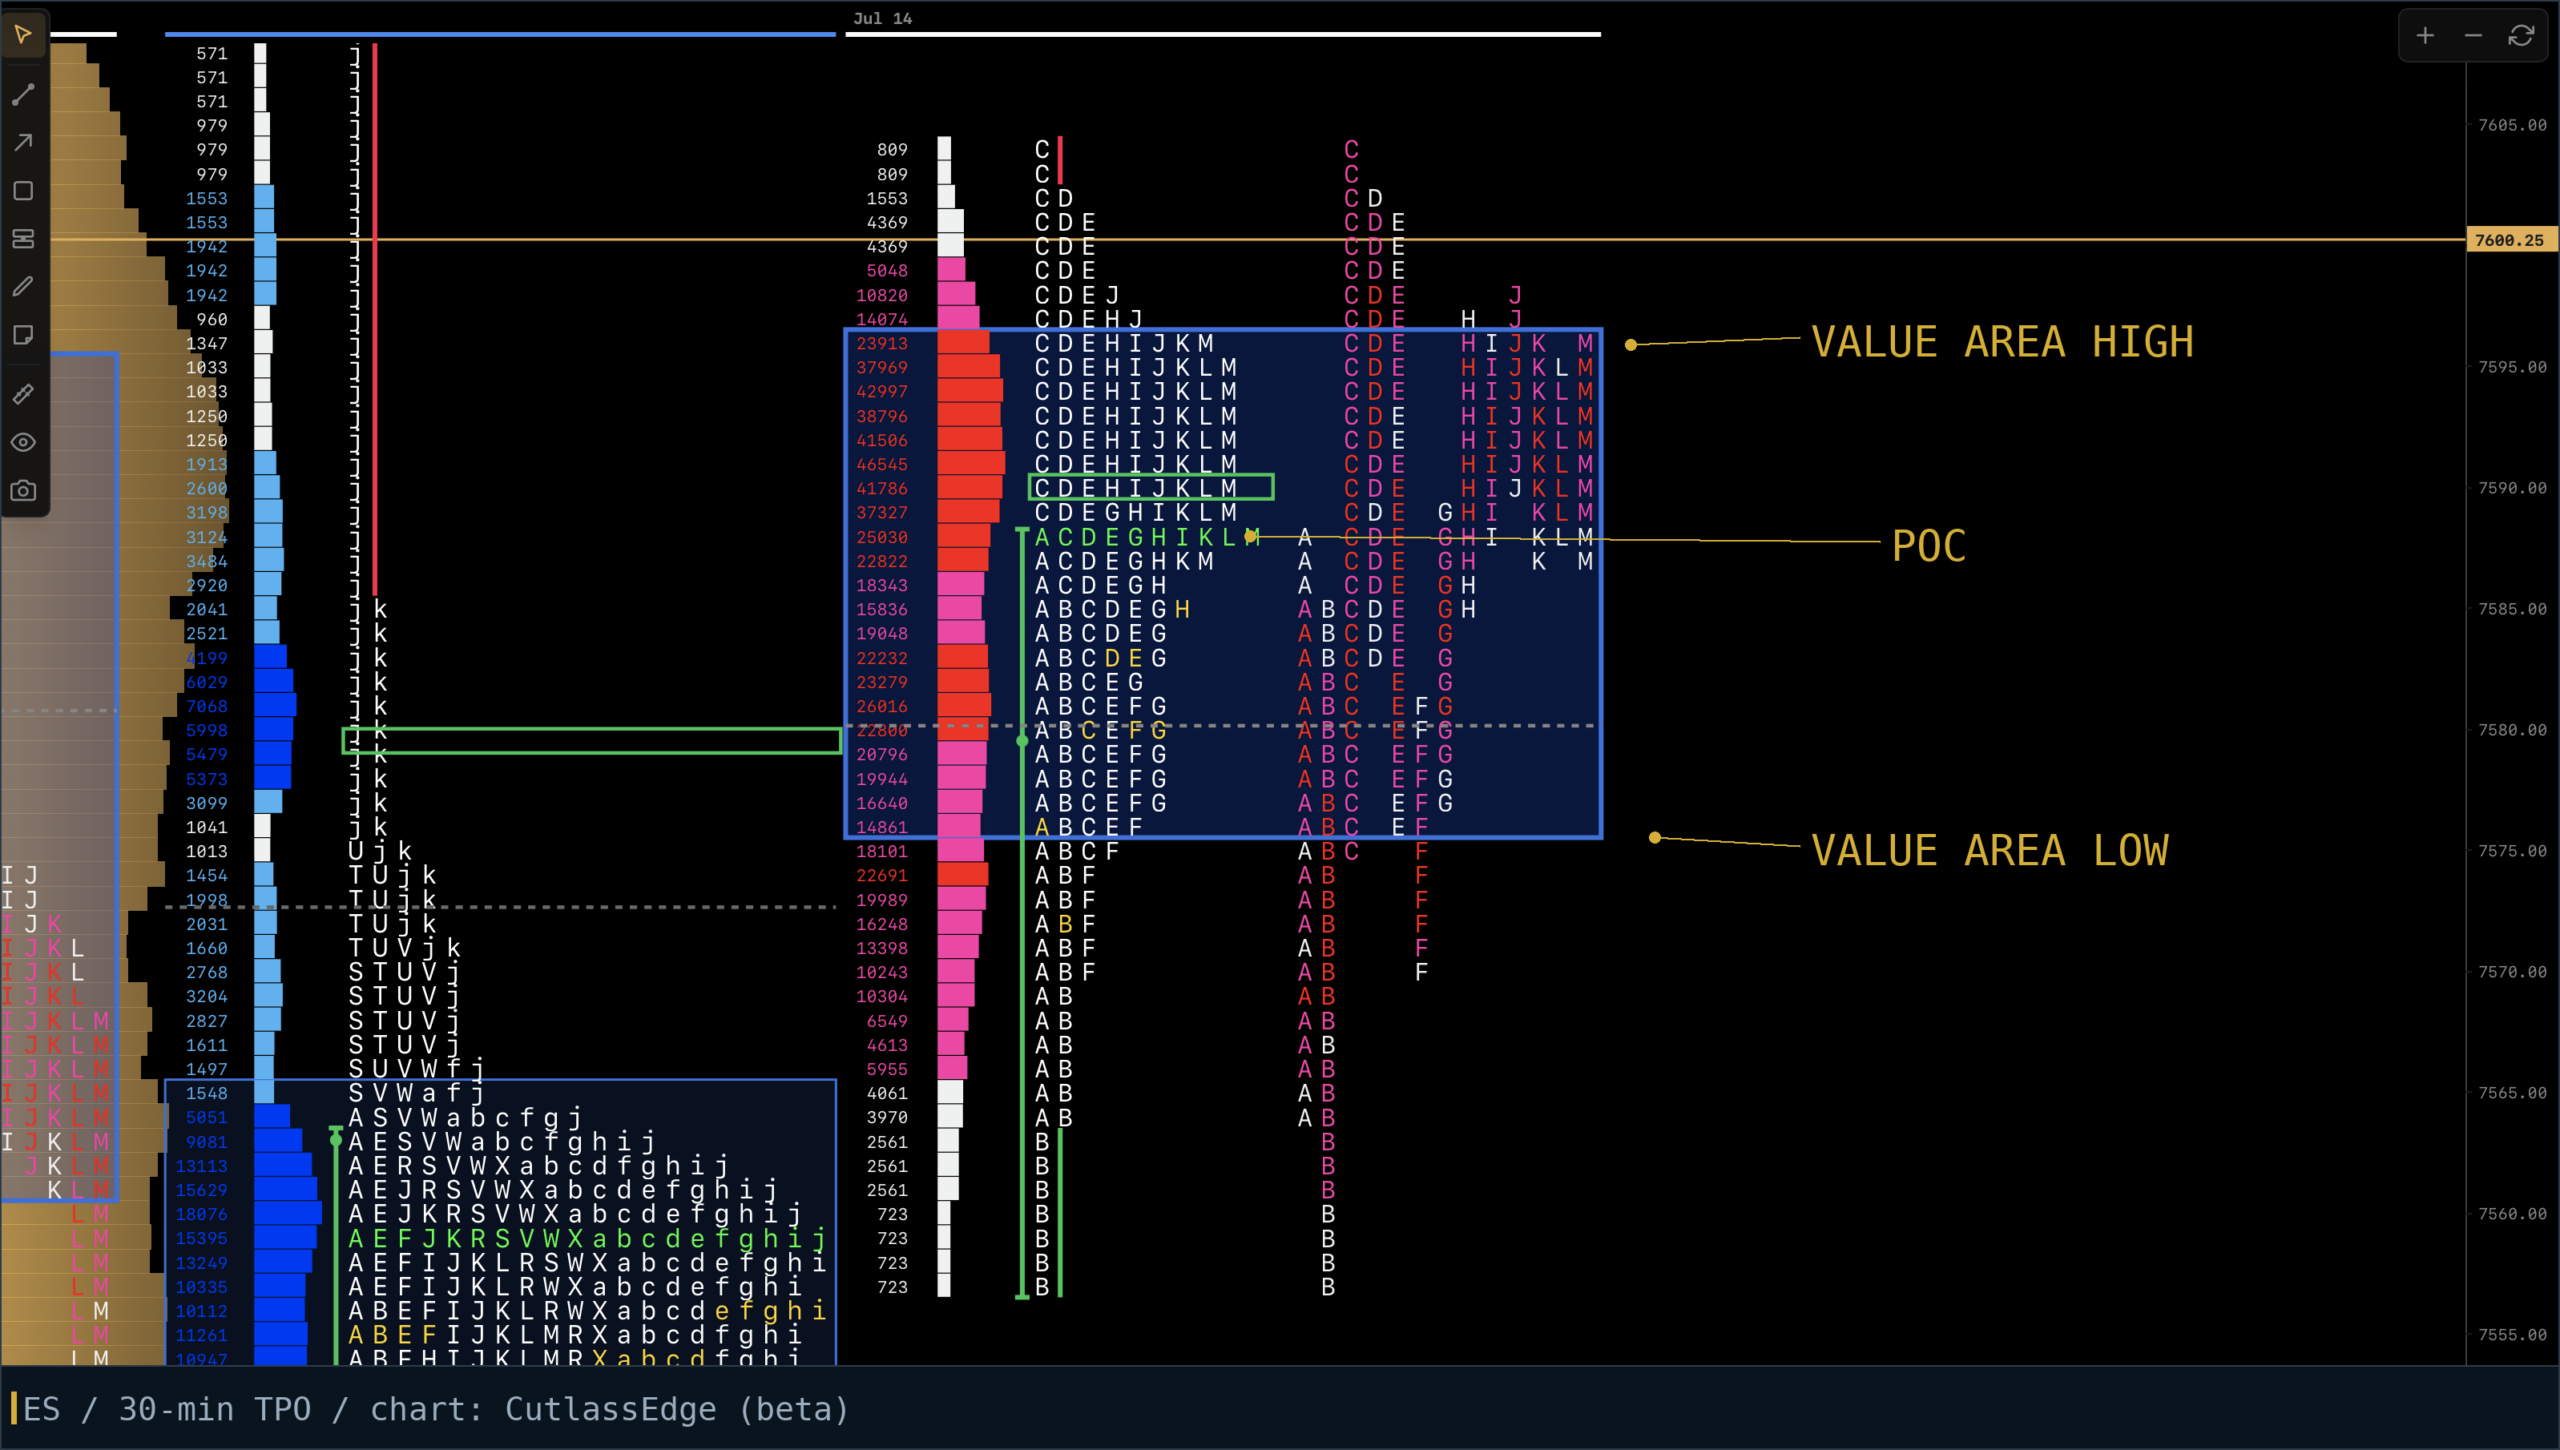
Formally: the value area is the price range containing roughly the middle 68 to 70 percent of the session’s activity, one standard deviation either side of the point of control. Its ceiling is the value area high (VAH), its floor is the value area low (VAL). Everything above it, the market considered expensive that day. Everything below it, cheap.
That’s the definition. The useful part is what value does from one day to the next, because those relationships are one of the fastest context reads in trading.
How the value area gets built
Start at the POC, the price with the most activity. Expand outward, adding the next most active prices, until you’ve captured about 68 to 70 percent of the session. The boundaries you land on are VAH and VAL.
Two flavors exist. A TPO-based value area counts time at price (letters). A volume-based value area counts contracts traded at price. They usually land close together, and when they don’t, that disagreement is itself information: time spent at a price without volume means the market idled there; volume without time means business got done in a hurry.
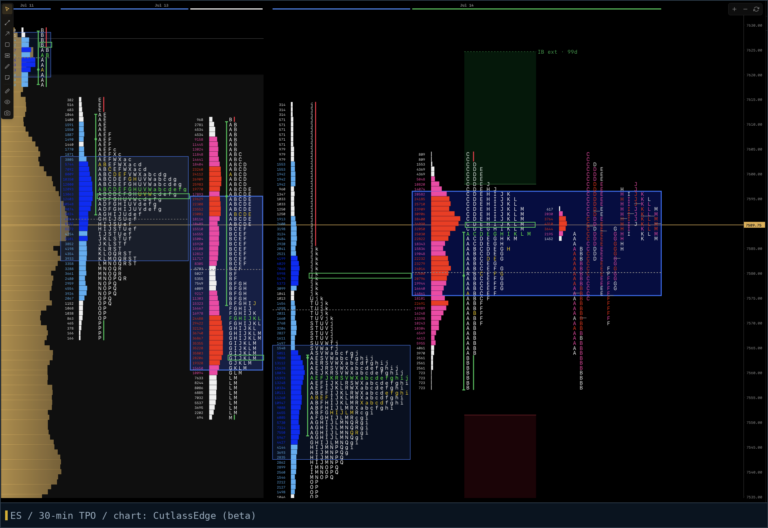
I personally use the TPO-based value area. I don’t pay much attention to the value area of the overnight range, but I pay very close attention to value from one RTH session to the next, for both swing and day trading. I also pay attention to how value is developing through the current session as another guide. But it’s important to remember the value area is a dynamic, not a static, reference. That means it is changing throughout the session, so just because the market might have overlapping to higher value in the early part of a session doesn’t mean it might not end up with lower value by the close. For those new to auction theory trading, it is best to wait for the close to use value as a resource until you have learned to understand how and when it changes throughout the session.
Why value matters at all
Because acceptance and rejection around value is the day’s plot.
Price trading inside value is the market agreeing with itself. Rotation, responsive trade, both sides doing business. Price venturing outside value is an advertisement: the market is looking for someone to do business at new prices. What happens next is the tell. If time and volume follow (letters start stacking out there), value is migrating and the move is real. If price gets slapped back inside quickly, the advertisement failed, and the odds favor a trip back across the range.
Fair warning from someone who trades this daily: value areas are references, not tripwires. VAH is not a sell signal. It is a place where the market’s opinion is on record, and where you should expect an argument.
The five day-to-day relationships
Each morning, compare where value is developing (or where the overnight sits) against yesterday’s completed value area. There are only five relationships, and each sets a different table for the day.
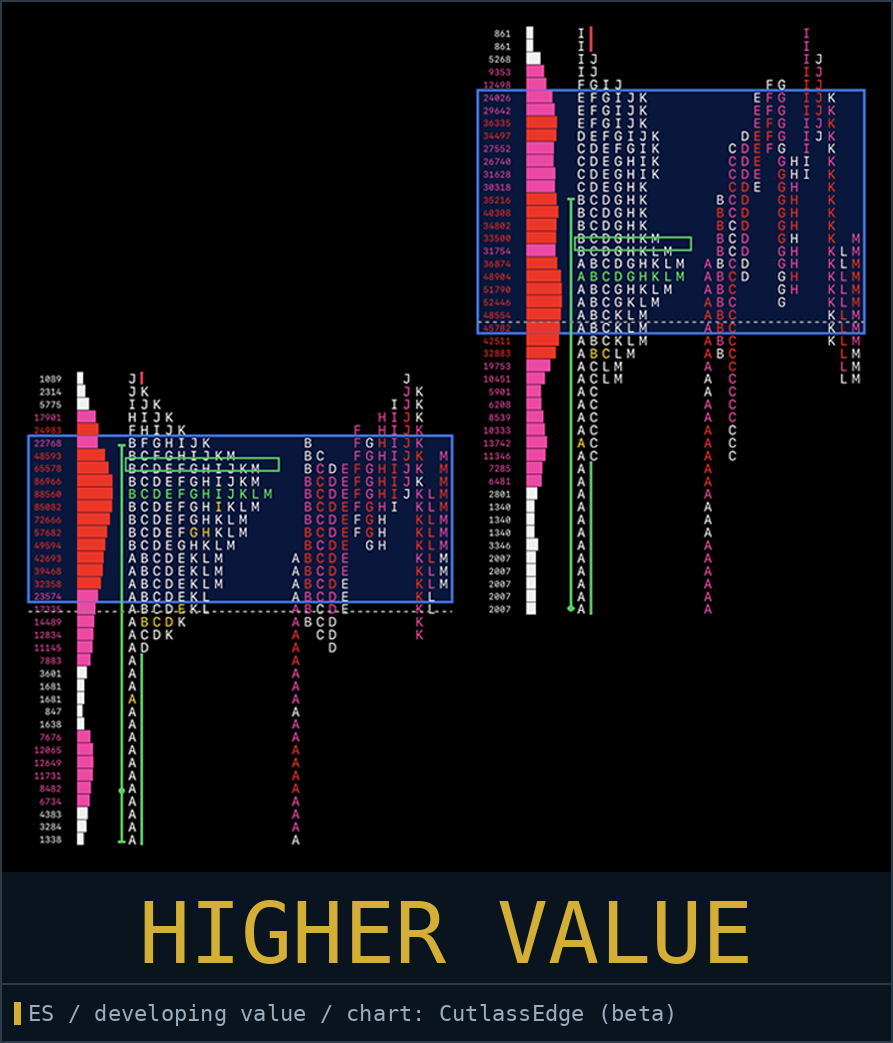
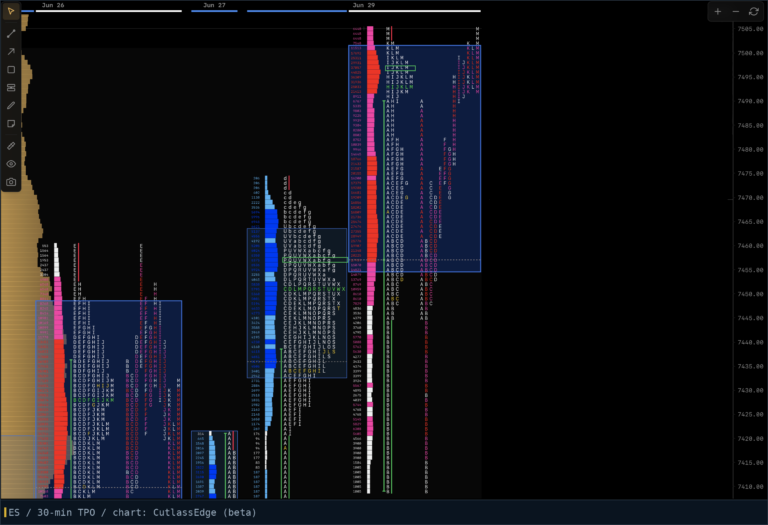
Value higher. Today’s value building entirely above yesterday’s. The auction has repriced upward and is doing business there. Balance-forward context favors buyers; the interesting question is whether the market can hold the new neighborhood.
Value lower. The mirror. Repriced down, sellers in charge of the story until proven otherwise.
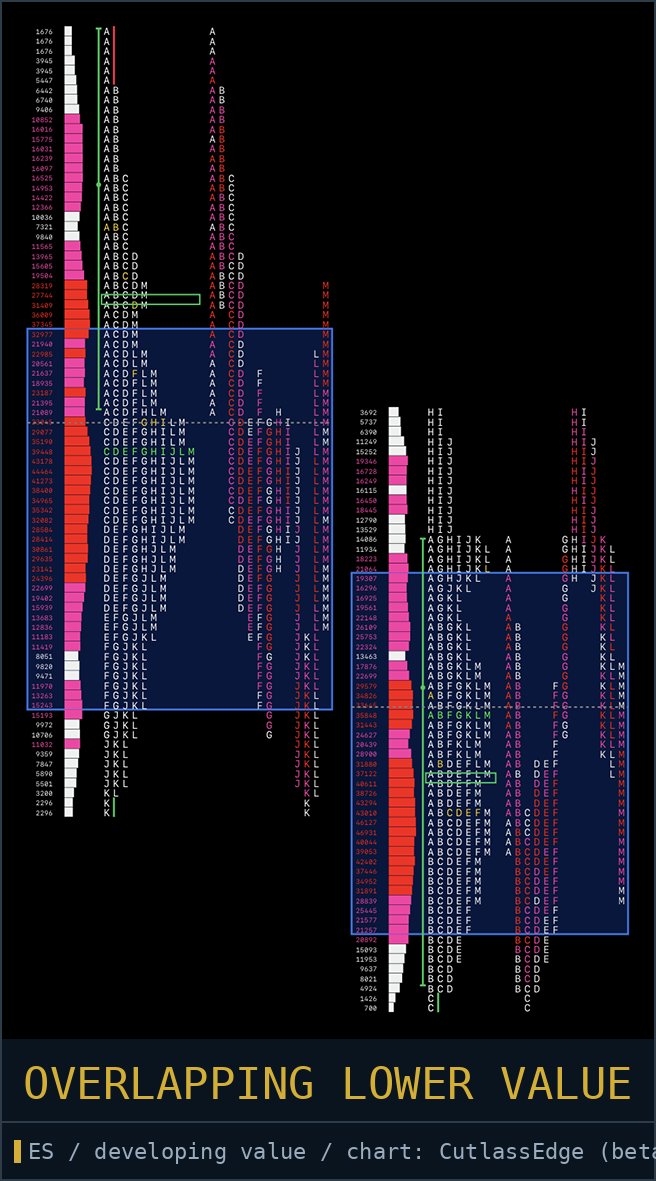
Value overlapping higher or lower. The market leaned a direction but did not commit; plenty of yesterday’s business is still considered fair. Expect more two-sided trade than a clean reprice.
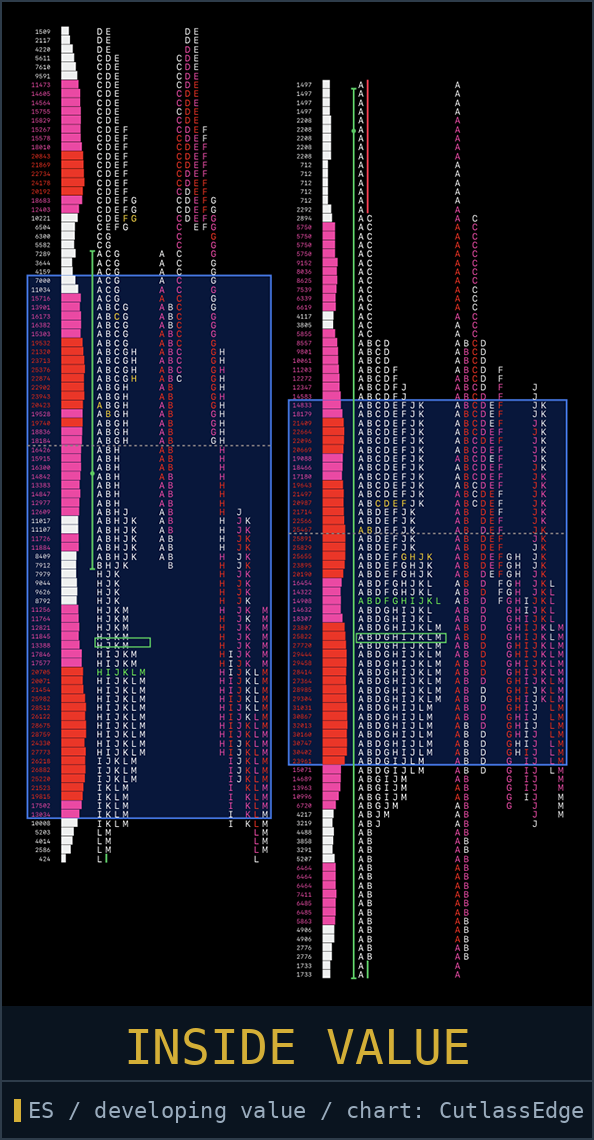
Value inside. Today’s value forming entirely within yesterday’s. The market is coiling, building energy and narrowing the argument. These days are often quiet and often precede the loud ones. This is balance, and the balance rules become your playbook.
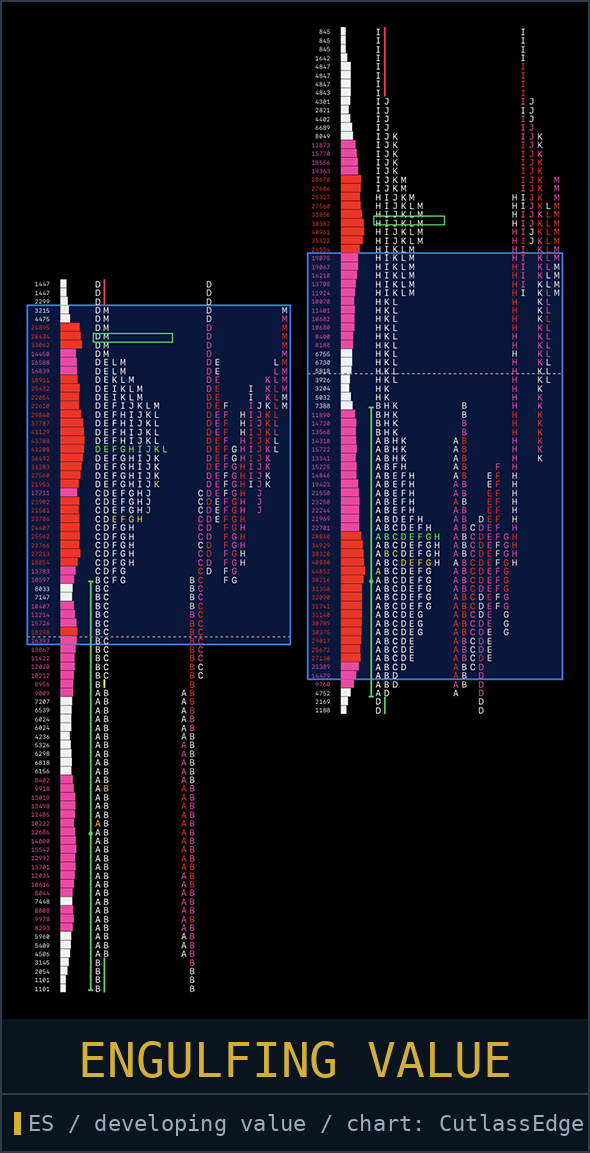
Value outside (engulfing). Rarer: today’s value swallows yesterday’s whole. Volatility without resolution; the argument got louder on both sides.
Value and the naked VPOC
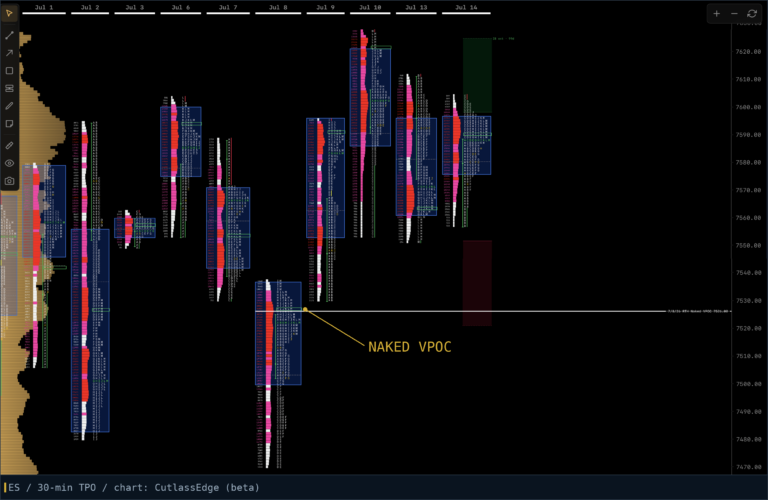
One more habit that pays: when a day closes, its VPOC and value extremes become references that persist. A POC the market never revisits stays “naked,” and old naked POCs act like unpaid bills on the ledger. When price finally returns to that neighborhood, they are natural targets. That whole idea gets its own guide.
Common mistakes with the value area to avoid
Don’t trade VAH and VAL as blind support and resistance. Context first: in balance, the extremes of value invite responsive trade; on a trend day, “expensive” gets more expensive all afternoon and fading value extremes is how accounts get blown up.
Make sure you’re not using the wrong session. Value built over the full 23-hour session and value built on regular hours answer different questions. Pick deliberately, not by whatever the software defaulted to.
Don’t anchor to one day forever. Value is a rolling conversation. Yesterday matters most, but a value area from six days ago that price never revisited is still live reference.
FAQ
What percentage is the value area?
Roughly the middle 68 to 70 percent of the session’s activity, one standard deviation around the POC. Platforms differ slightly in method; the concept is identical.
What do VAH and VAL stand for?
Value area high and value area low: the top and bottom boundaries of the value area.
What is the 80% rule in market profile?
If price opens outside the prior value area and then gets accepted back inside (conventionally two consecutive 30-minute periods), the odds are said to strongly favor a rotation across the entire value area. Real pattern, folklore precision. “80% rule” is just the name, not a real statistic.
Should I use the TPO value area or the volume value area?
They usually agree within a few ticks. Pick one as your primary so your levels are consistent, and note the rare days they diverge, because that divergence is information.
Does the value area work outside futures?
The auction logic carries to any liquid market. The conventions and worked examples in the literature are index futures, which is where I trade it.
Charles Gough is a full-time ES futures trader and the founder of Pirate Traders. The charts in this post were produced in the CutlassEdge development build.
Market Profile is a registered trademark of CME Group. It’s used here descriptively, to discuss the methodology.